
One of the most important pieces of information for operating managers to know is how many guests with they serve. In addition, how many guests will be served in a week, every 2 weeks, a month, etc. The answer to these questions are vital because the guests will generate revenue, which the operating manager will use to pay for expenses and create a profit.
This is a very common piece of information for operating managers. A manager will need both revenue and guest counts to calculate this value.

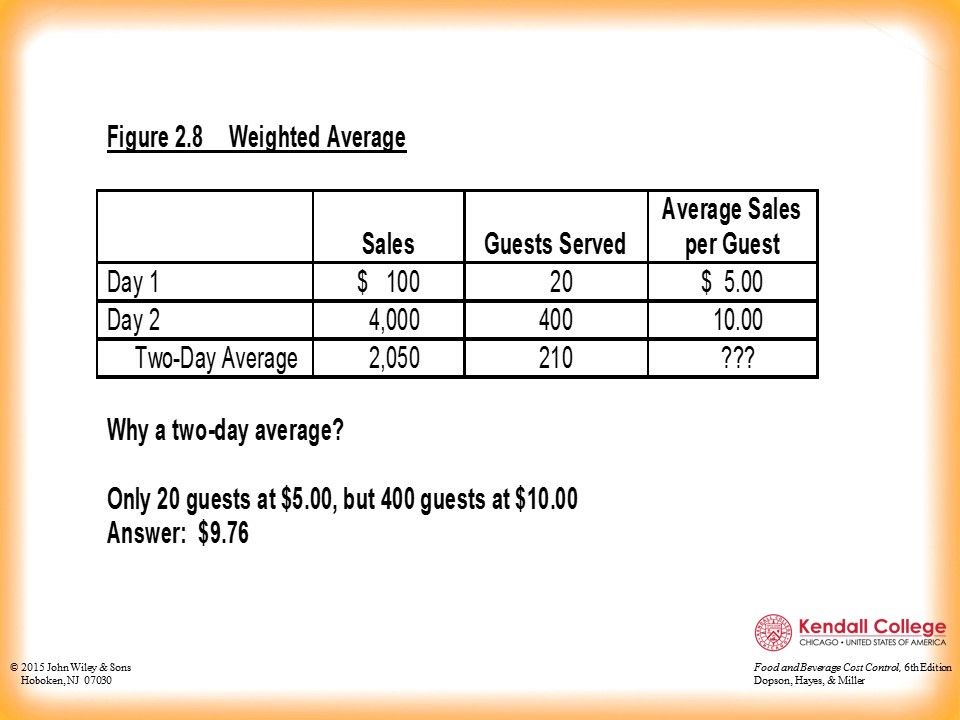
A weighted check average is calculated by taking the total number of guests divided by how much they spent in a specific time period. For example, a manager can know the monthly averages and use those data points to determine the yearly weighted check average. There’s an example of this in the video below.
Need Academic Help? Contact the Academic Success Center (ASC)!

Sales variance is the change from the last year to the current year.
Percentage Variance is the sales variance represented as a percent.

Managers want to predict the future by forecasting the potential revenues, guest counts, or average sales per guest levels. By using data collected from previous years, managers can plan more effectively for expected increases in sales.

***You can apply this formula to Guest Count Forecast.

Examples by hand:
Examples in Excel: